By Bruno Dupire, Head of Quantitative Research at Bloomberg L.P.
Establishing a link between current observables — structured and unstructured data — and future behavior is a major undertaking in finance, and naturally the field is embracing machine learning to tackle this typical learning task. This requires broadening the range of data and methods, and shaking some old habits.
Conventionally, the majority of financial data was processed in structured form — such as numerical information from markets and security prices — and the methods to process it were borrowed from the standard statistical toolkit. Advances in machine learning and processing power mean it is now possible to process (and make sense of) vast amounts of unstructured data, which brings with it the potential to transform the industry.
Relevancy in datasets
Market participants are gradually recognizing that many dimensions of the world are interconnected and that discerning this web of interactions may unleash some forecasting power. Previously overlooked sources are now being mined for important and potentially profitable data.
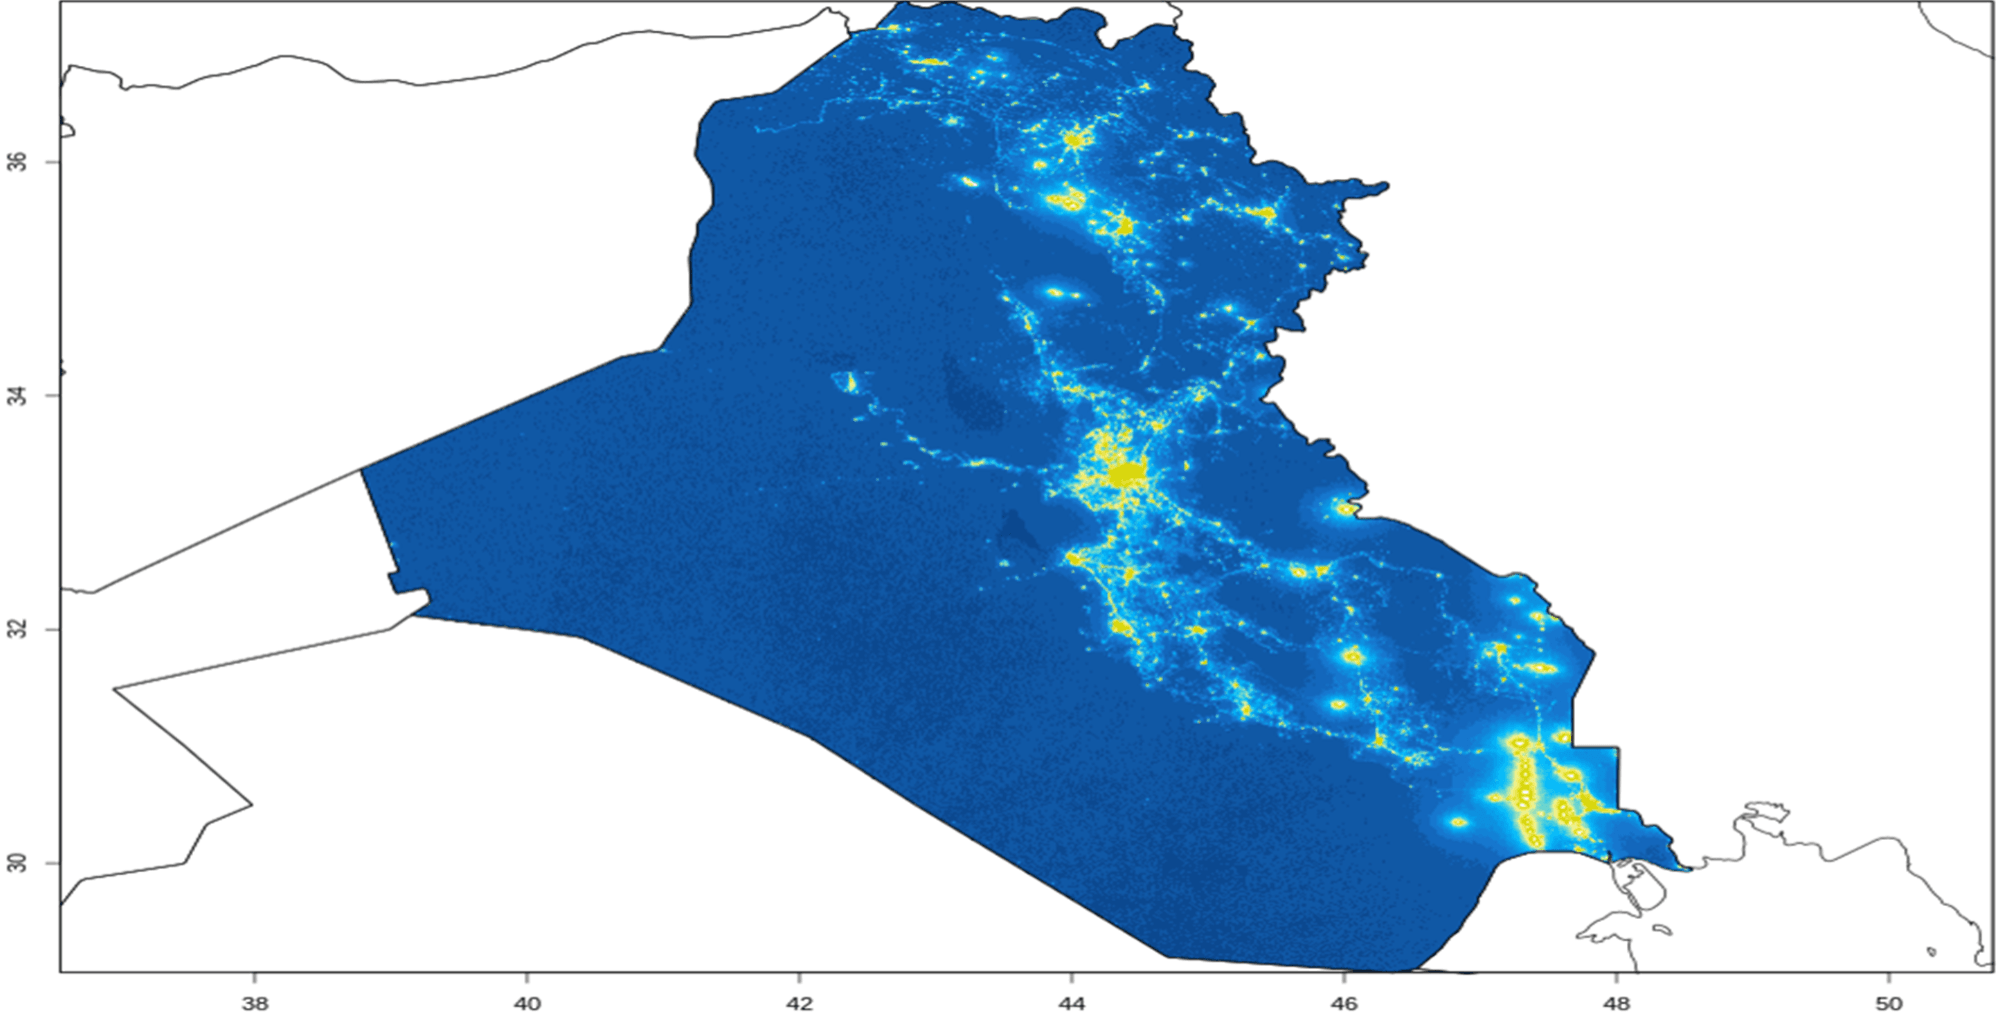
Satellite images of night light intensity, oil tank shadows and the number of cars in parking lots, for example, can be used to estimate economic activity. Social media activity and news stories can be used to determine sentiment, while credit card usage can reveal important consumer spending trends.
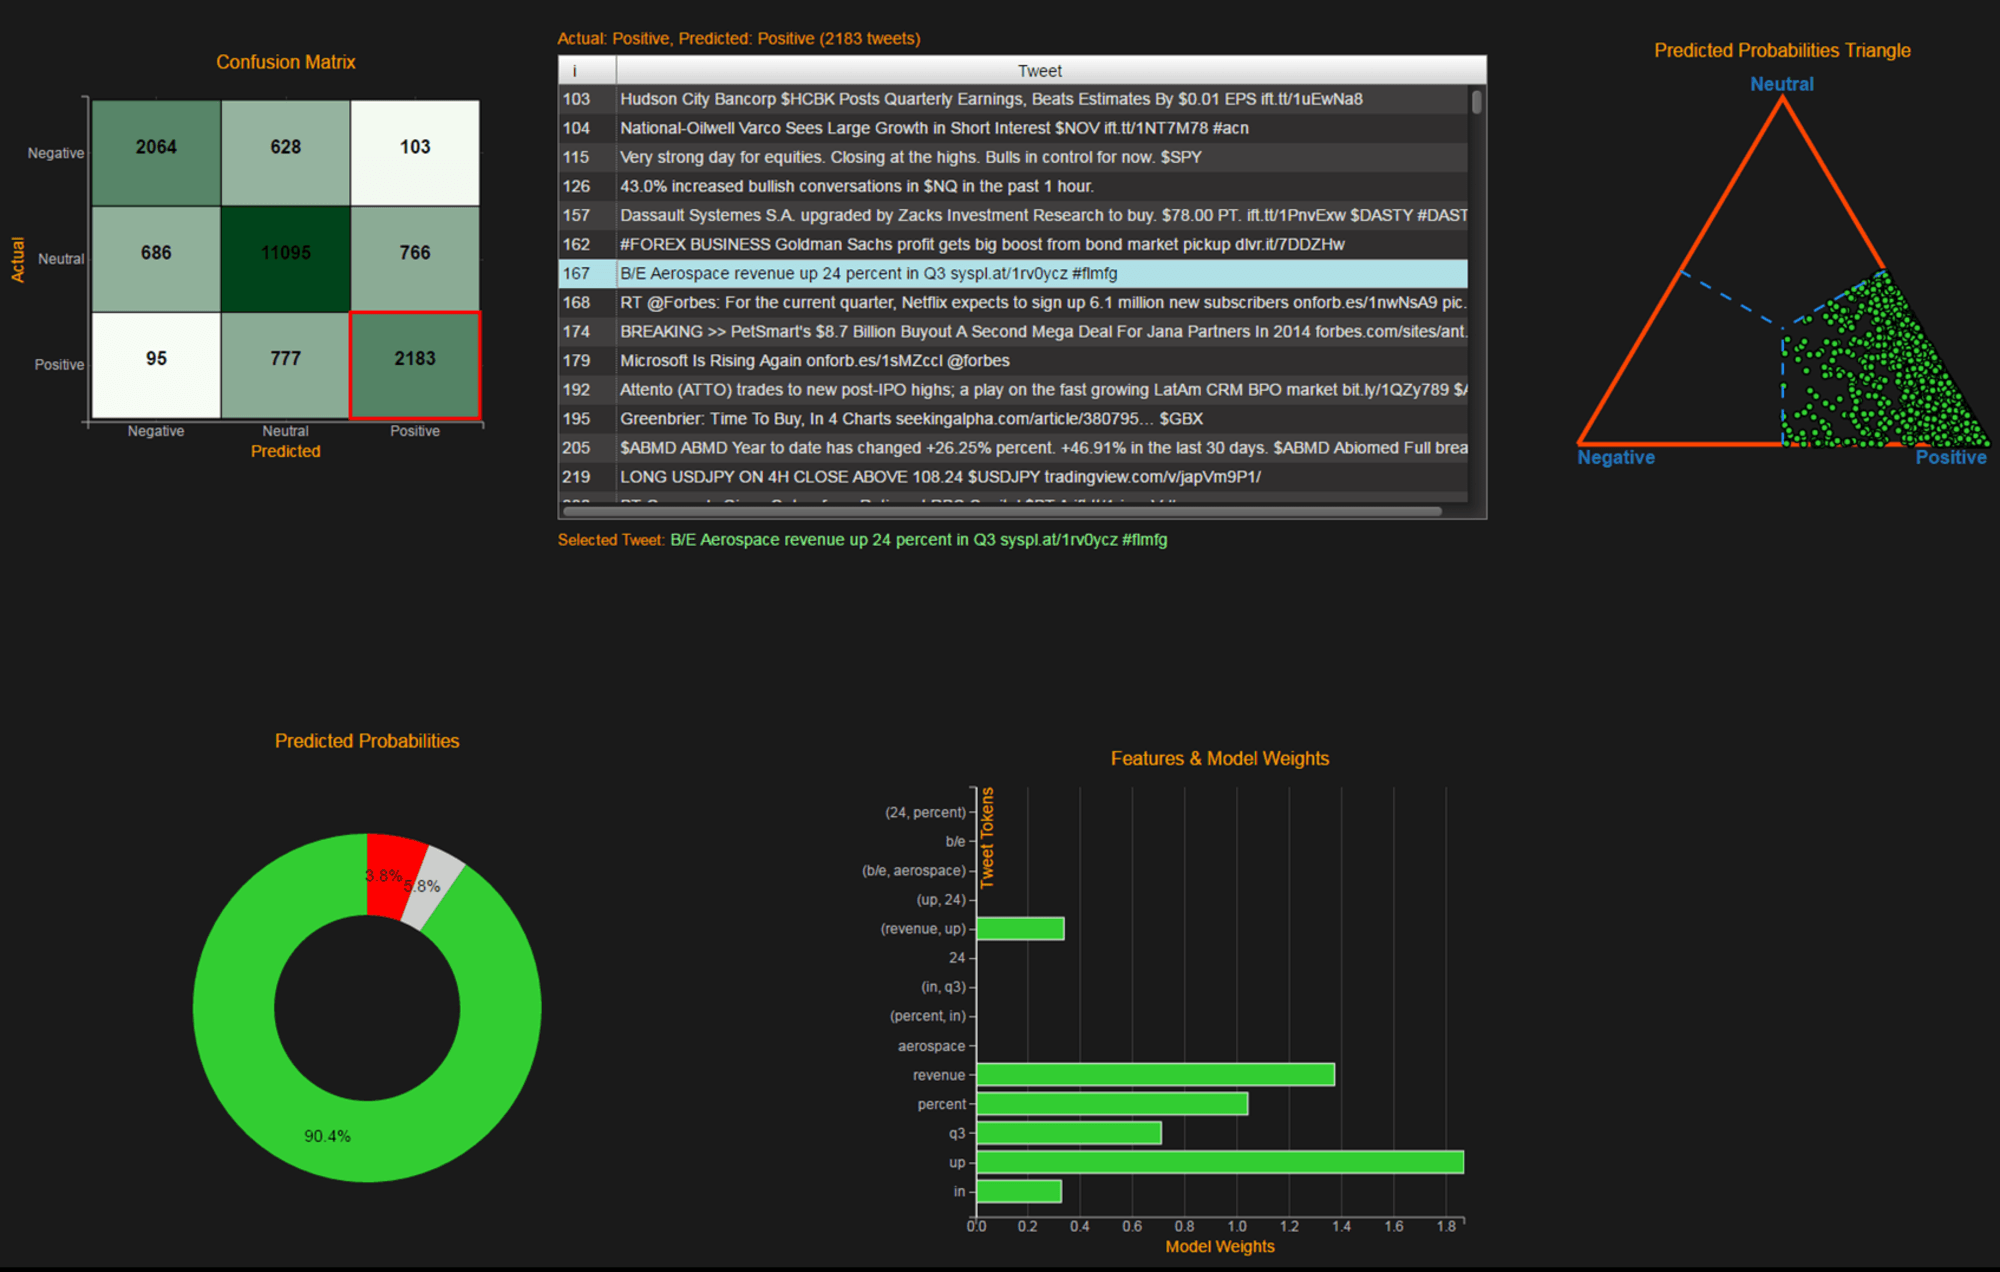
A first set of techniques transforms the raw data into a numerical value: a night satellite picture is converted into a measure of light intensity; a photo of a parking lot is analyzed to reveal the number of cars; language in a news article or tweet is placed on a polarity index to predict positive, negative or neutral sentiment.
A first set of techniques transform the raw data into a numerical value. For example:
Night satellite picture: measure of light intensity
News article or tweet: polarity (good/bad) index
The next step is to use this data for forecasting. Can we use light intensity to forecast spending vs GDP of a country? Can we estimate earnings by looking at parking lots of Walmart etc.? Can we estimate price return or volatility of a company by using the social media sentiment about that company?
Machine learning methods
There are various types of machine learning methods which can be used depending on the kind of data available and the goal. The most common ones are:
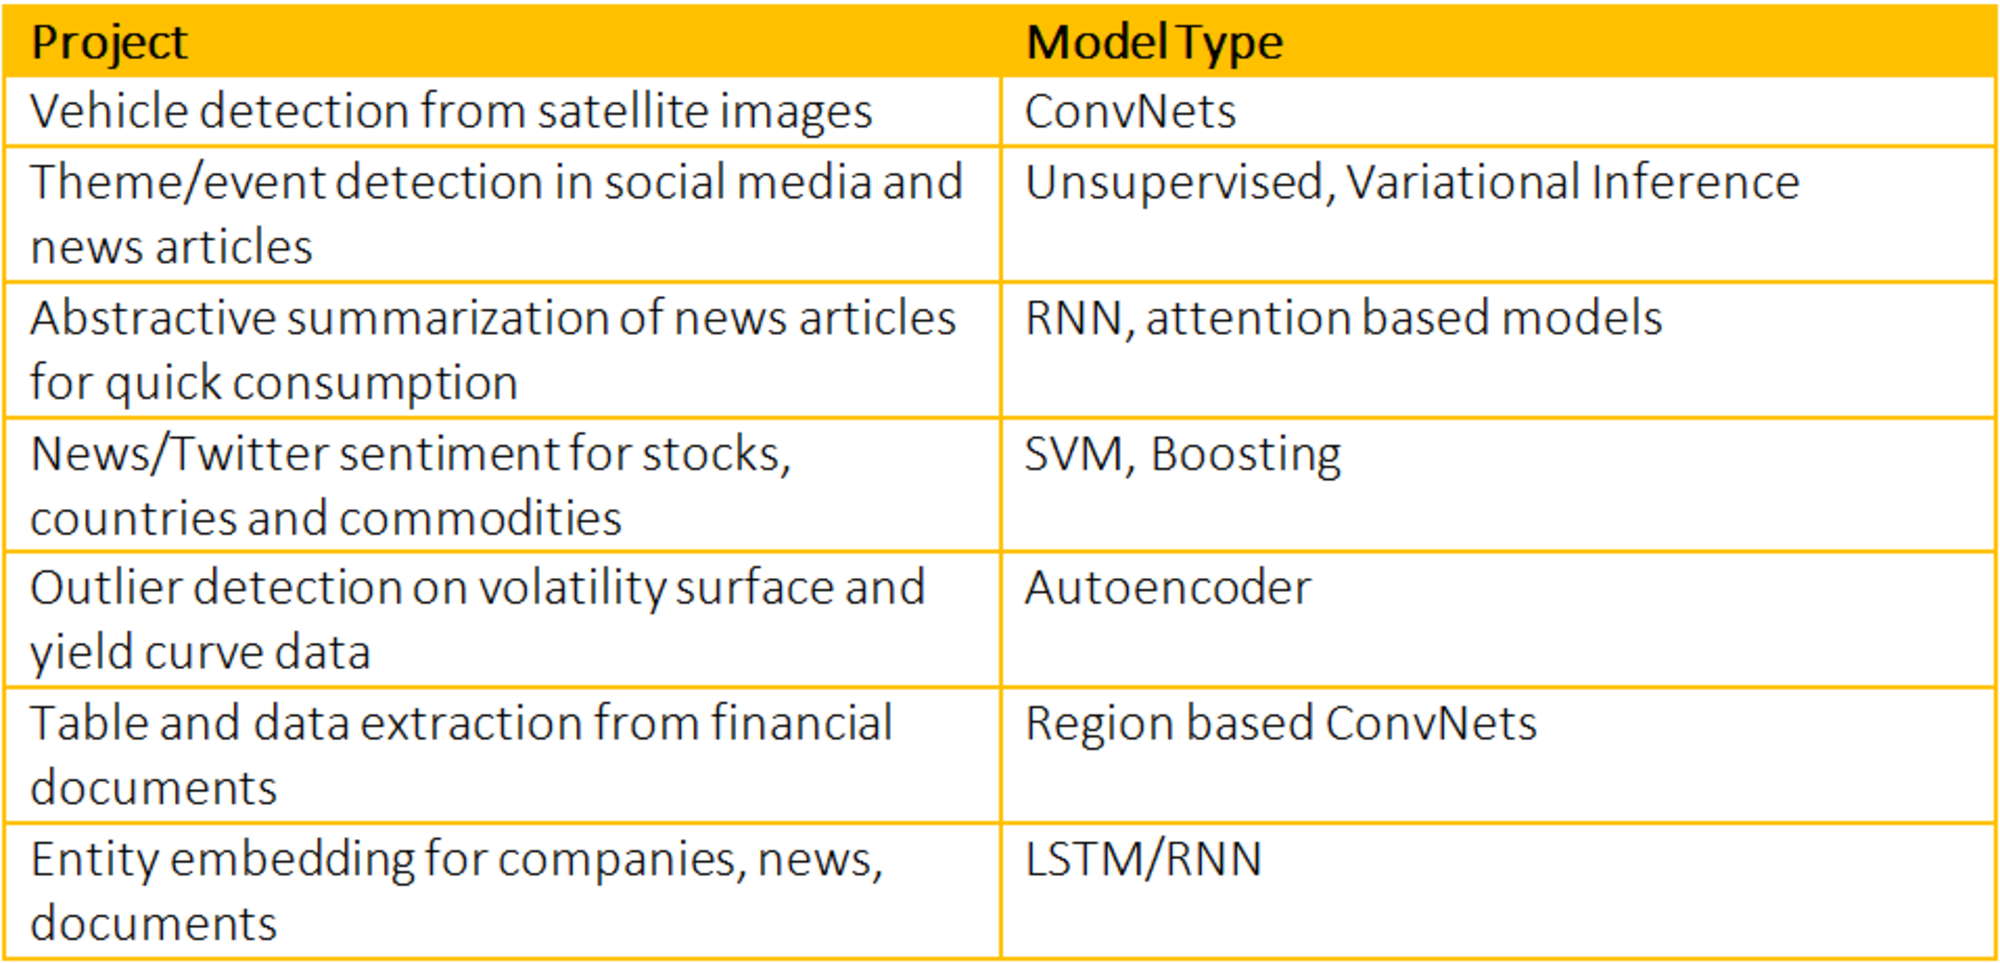
The list of tasks that can benefit from machine learning is endless. The following table shows some of the machine learning projects we’re working on at Bloomberg:
Autoencoders for dimensionality reduction
One interesting use of neural nets is to reduce the dimensionality of, for instance, yield curves or volatility surfaces. For yield curves, traditionally the most popular technique used is Principal Component Analysis (PCA). In the context of the yield curve, the three most important components are identified as parallel-shift, slope and twist.
An autoencoder network is more efficient for dimensionality reduction than PCA as it can make full use of the non-linearity it generates. An autoencoder network aims to reproduce as output the initial input forced through a bottleneck that distills the input information into a compact representation. Typically, it is observed to work better than PCA when there is a change in global behavior or a change in regime.
We can use supervised learning algorithms to learn signals that can generate alpha or learn how to construct portfolios for different market conditions. Two such examples are:
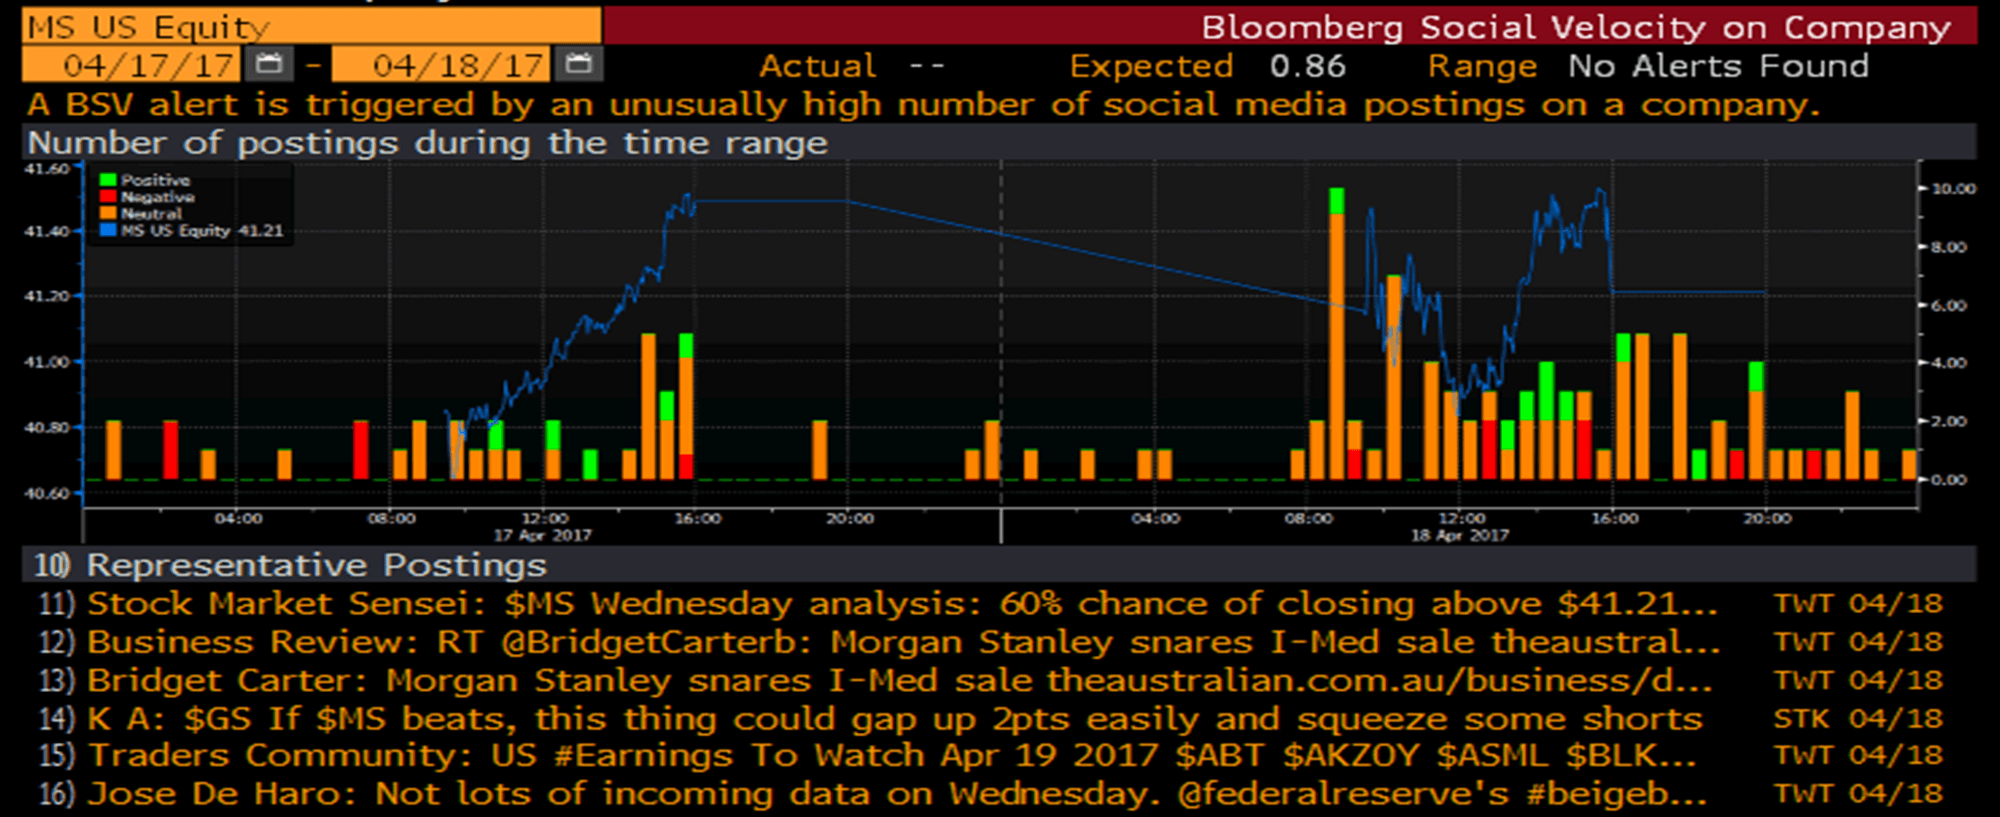
1) Sentiment based strategies: Text from tweets or news can be analyzed and automatically tagged as expressing positive, neutral or negative sentiment. For instance, the chart below summarizes the number of the three classes of tweets for a stock (MS) for each 15-minute time slice over a period of two days.
Analysis of this processed data leads to trading signals that can be used to construct a trading strategy, typically by going long on positive sentiment stocks and shorting the negative sentiment ones. In the chart below we can see that such a portfolio outperforms the market significantly.
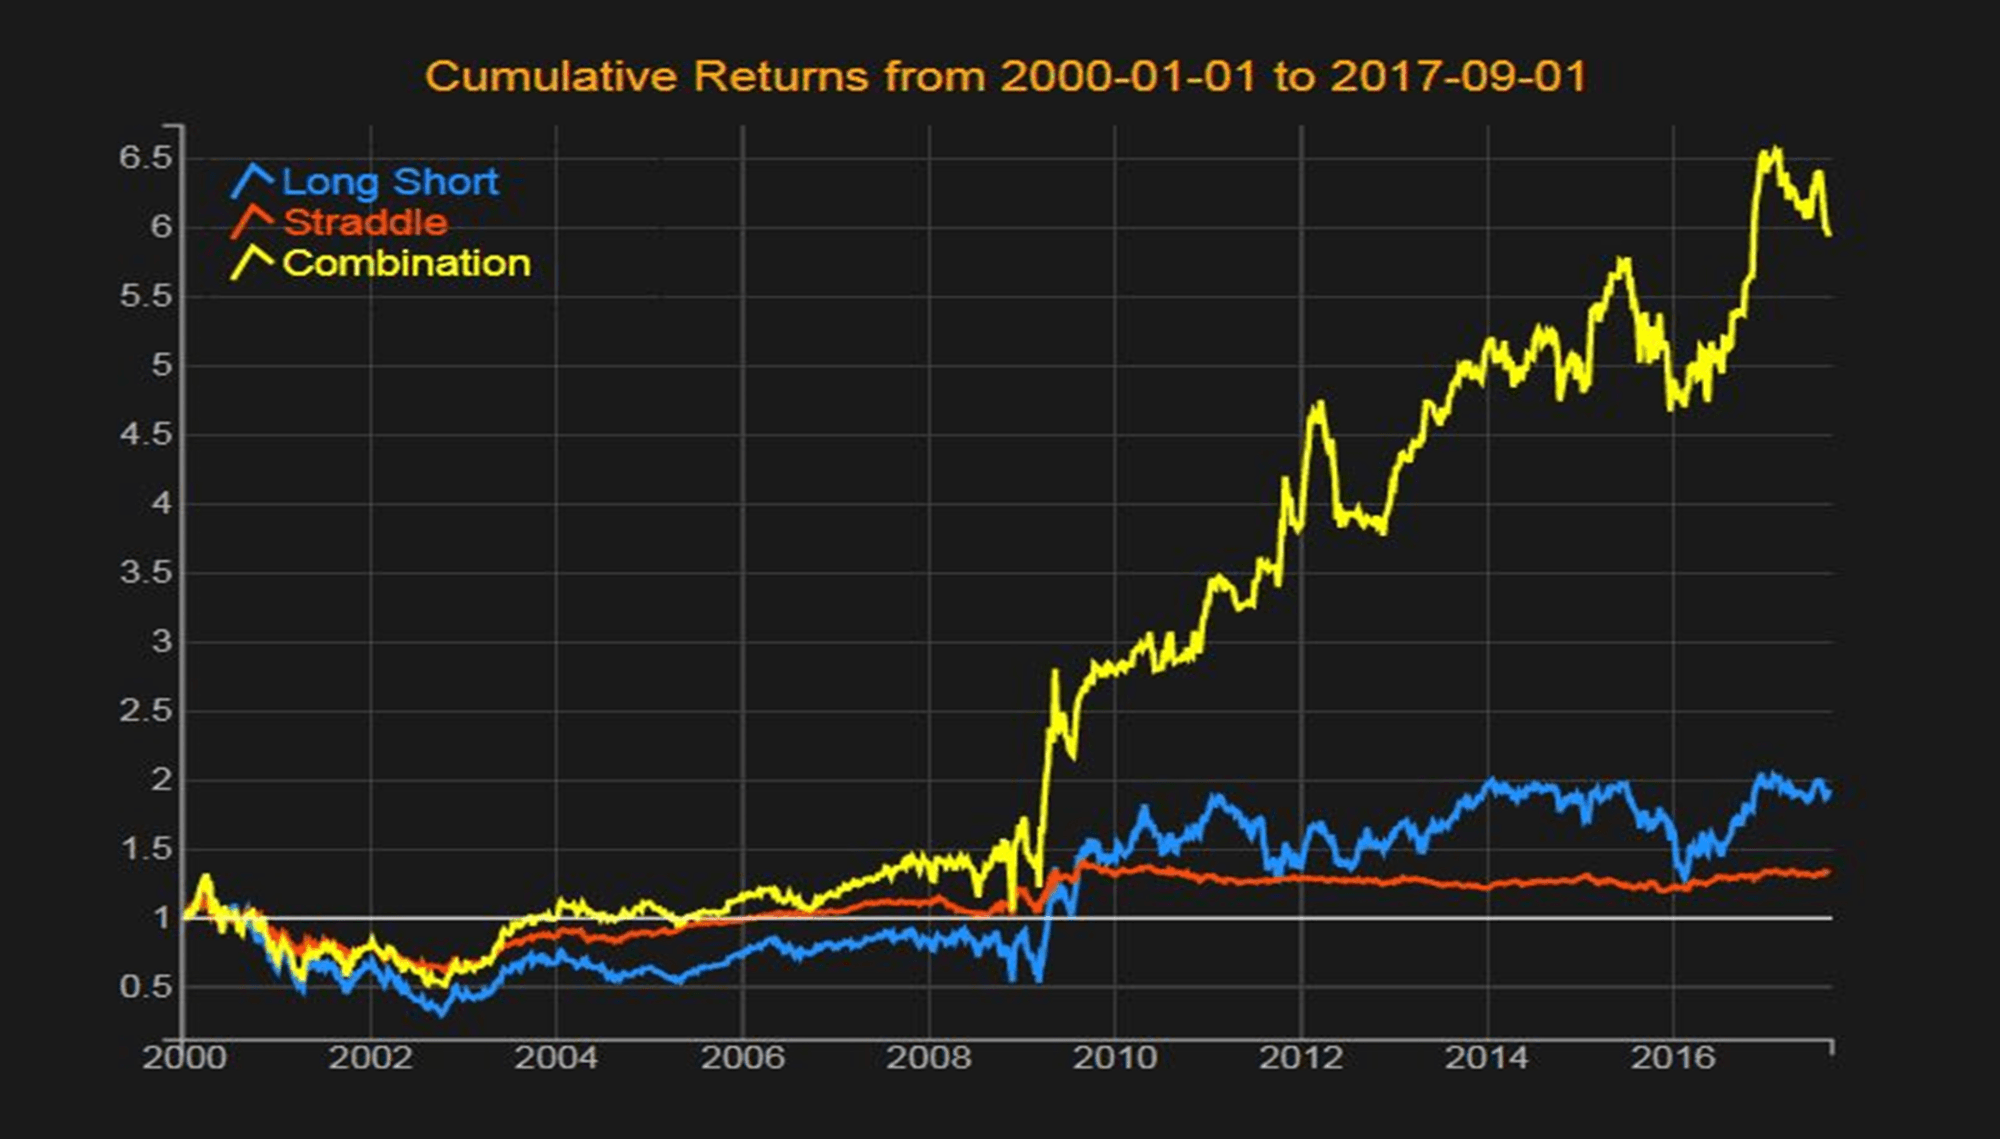
2. Smart beta strategies: Another way to make use of data to elaborate a trading strategy is to find a set of characteristics that represent the market conditions and then define a list of factors or strategies. Then the learning task is to establish a link between the market conditions at a specific time and the best strategy to apply on the subsequent time period.
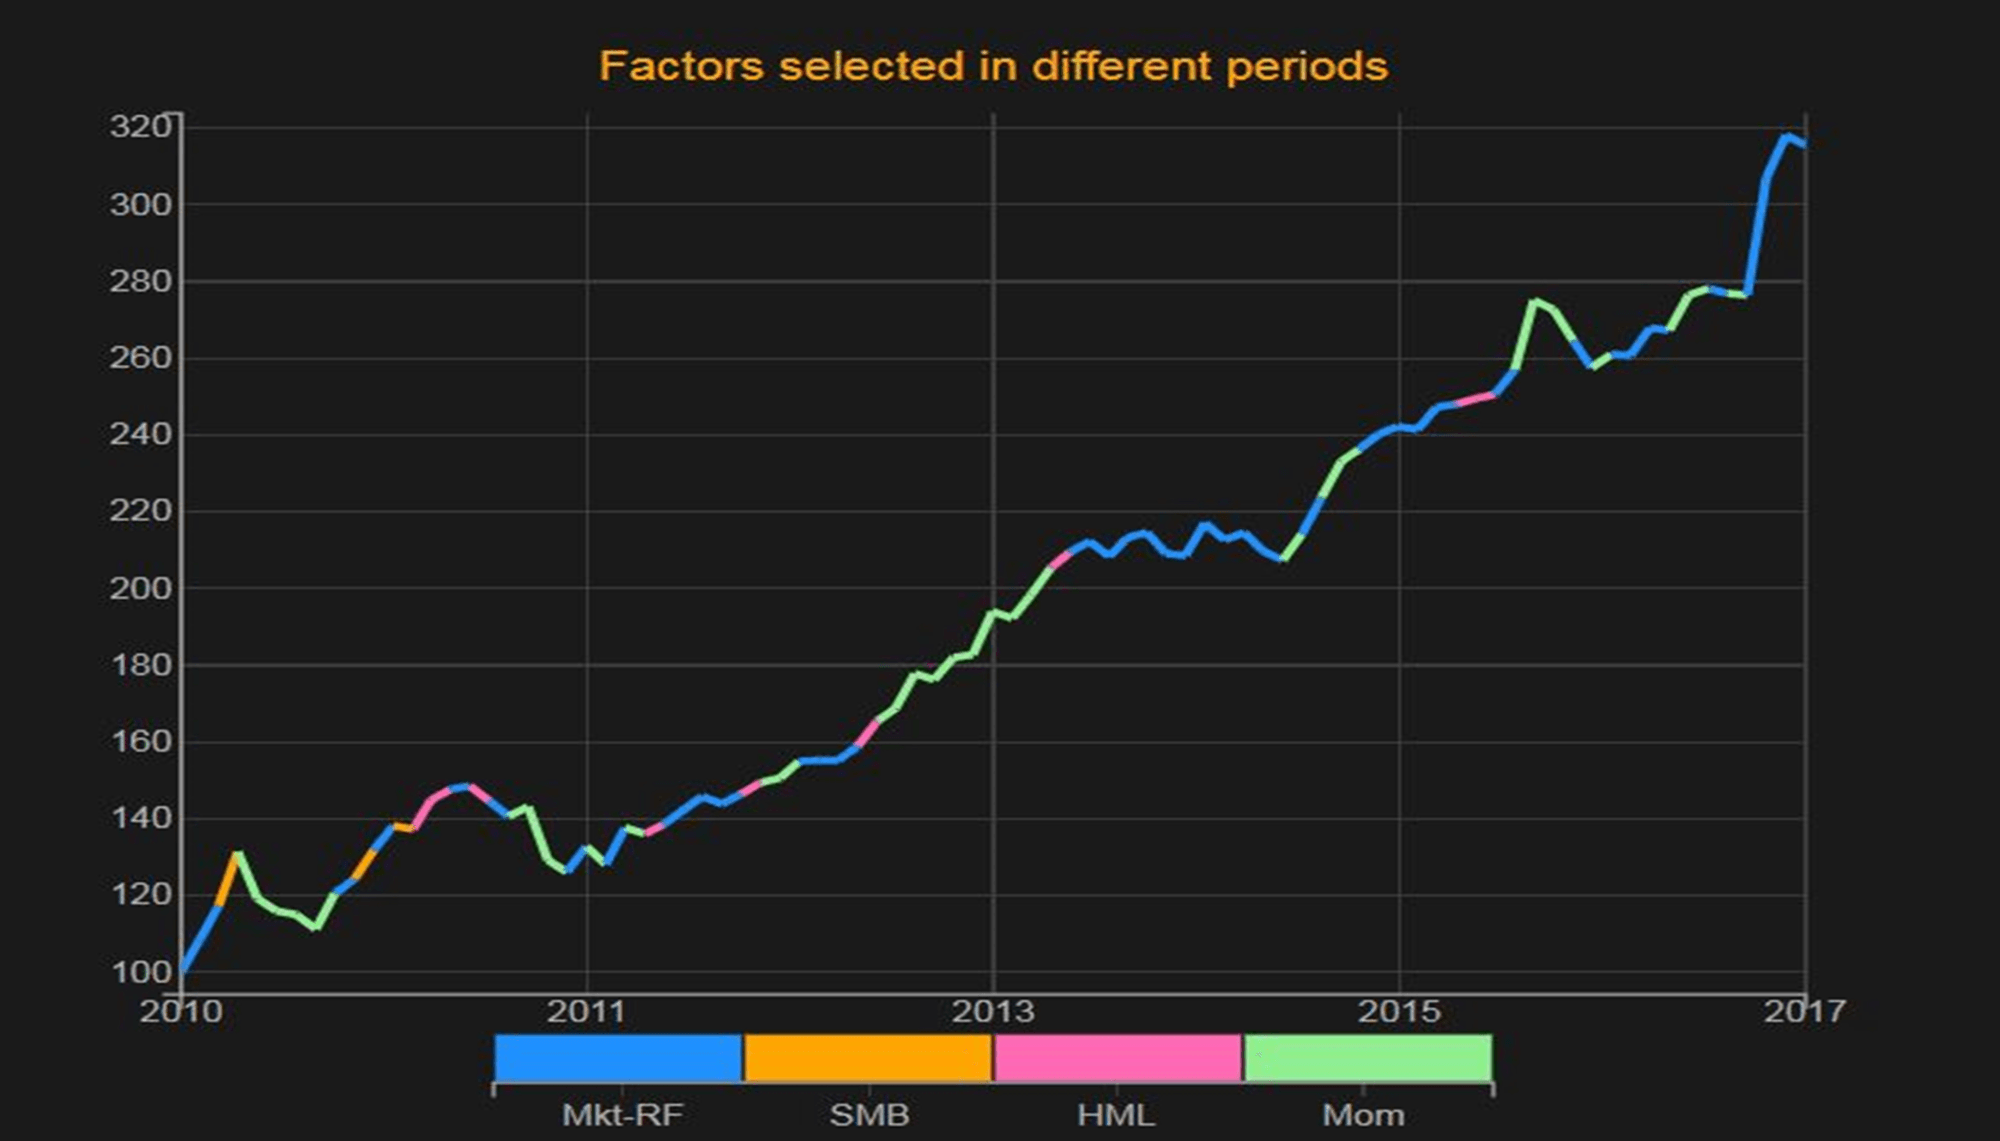
Examples of characteristics that can be used to define market conditions are: SPX returns; VIX level; yield curve slope; credit spreads; and inflation. Examples of strategies are: portfolios with securities weighted according to the value/rank of a parameter such as the beta of the portfolios; and different smart beta funds such as those associated with the Fama French factors or geographical regions or industrial sectors.
The supervised learning consists of learning over the training period the association between the most profitable strategies and the corresponding market conditions. Once the system has learned these associations and can mimic them, it is tested on an out-of-sample period.
This chart illustrates the benefit of learning how to dynamically shape a portfolio according to the beta quantiles and how it outperforms a typical long-short portfolio.
This chart shows the optimal strategy selected for construction of a rotation strategy of the Fama-French factor portfolios:
Conclusion
The availability of new datasets and techniques, and increases in computing power have expanded the applications of machine learning in finance. The field is still nascent and filled with traps, but holds great promise as a new generation of techniques, tools and talent begins to unlock its full potential.