The greening of European companies
Using EU Taxonomy data to uncover investment trends
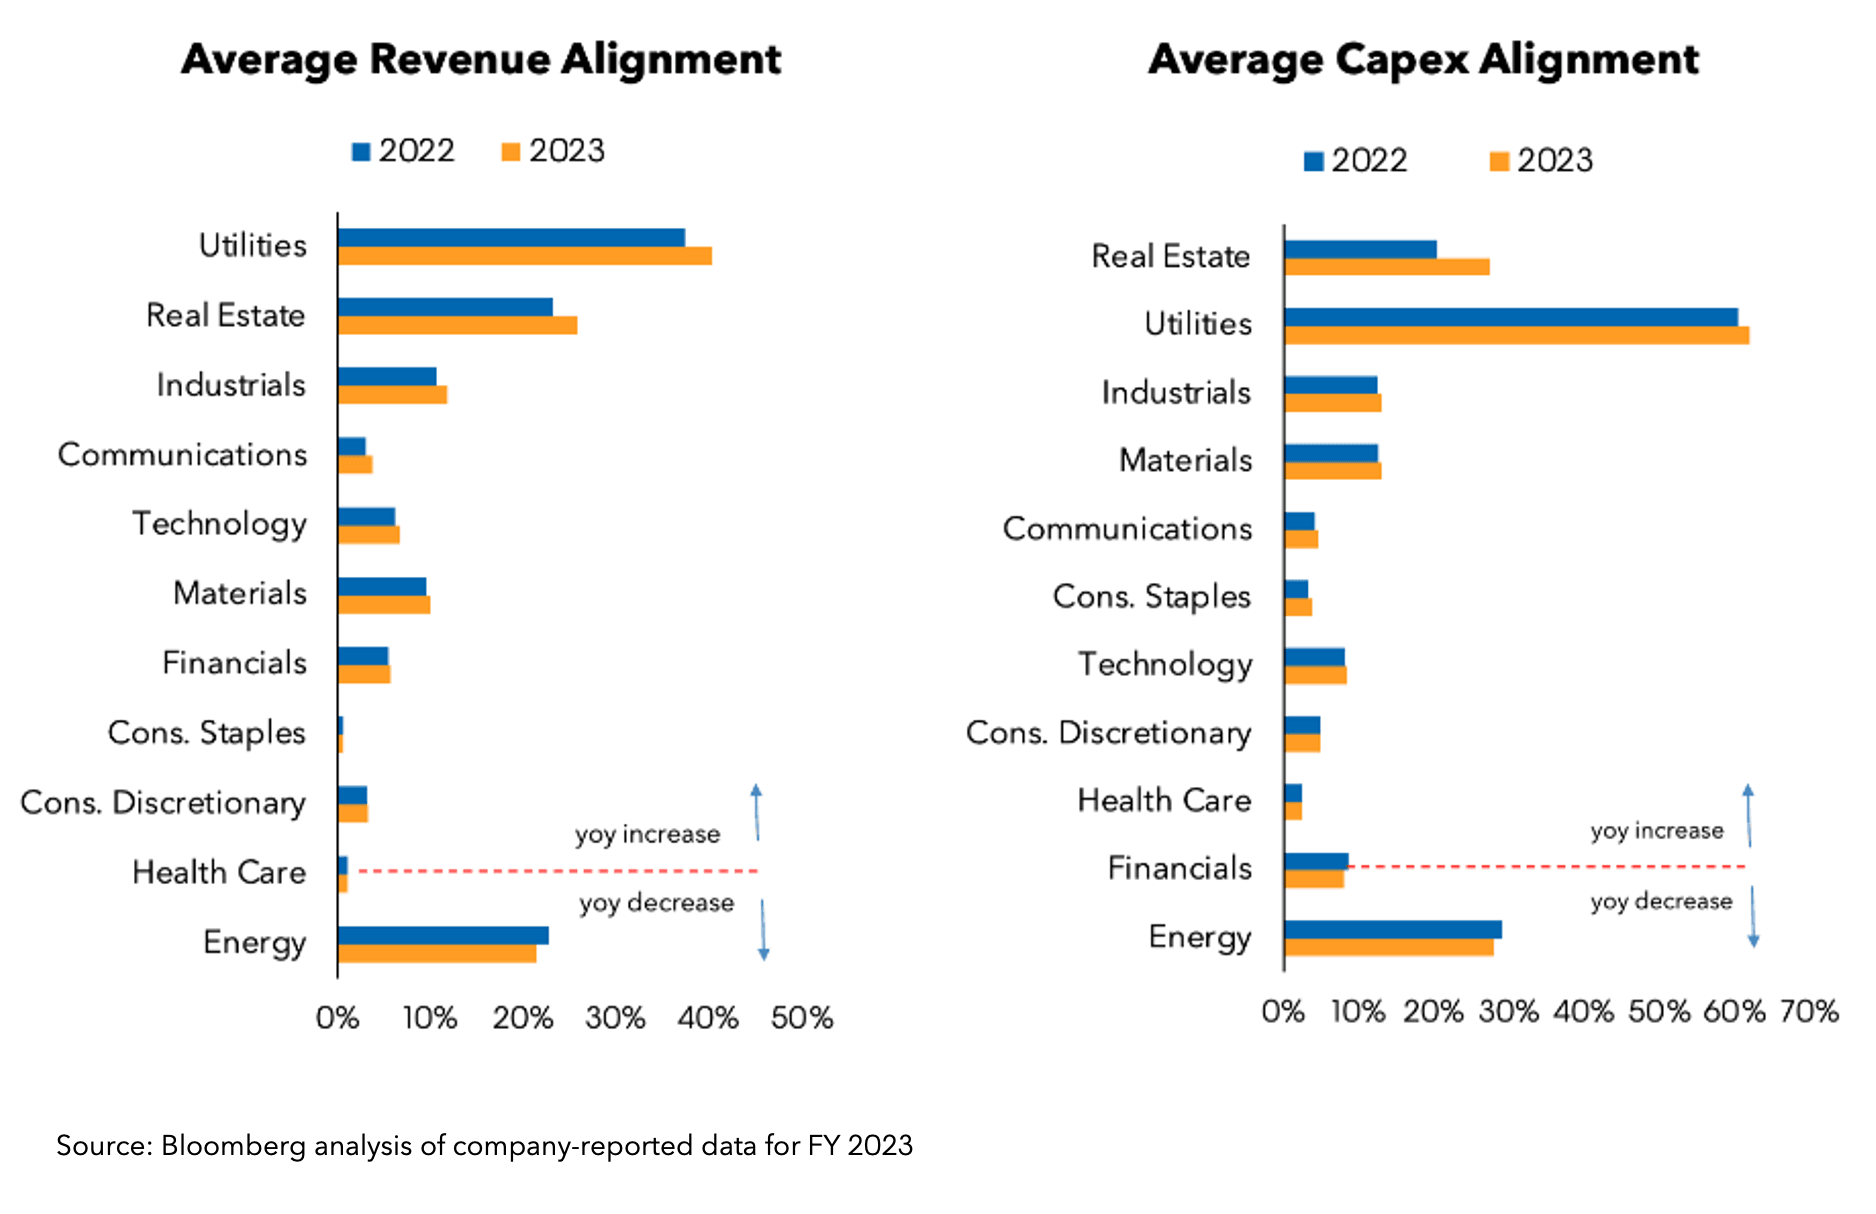
While Taxonomy-aligned revenue shows the sustainability of a company’s current activities, Taxonomy aligned CapEx is an indicator of a company’s future sustainability.
On average across all sectors, revenue and capex alignment increased by 1% between 2022 and 2023. Utilities and Real Estate experienced the highest increase in alignment, reflecting the expansion of renewable generating capacity and green residential/commercial stock.
Conversely, taxonomy alignment declined in the Energy sector as higher revenues from oil & gas suggest that many companies may be deviating from the net zero pathway.
The year-on-year stability of reported alignment is indicative of the quality of reported data and enhances the value of the EU Taxonomy to portfolio managers as an investment screening tool.
The EU Taxonomy metrics disclosed by companies help financial firms identify opportunities in their universe of counterparts/investees.
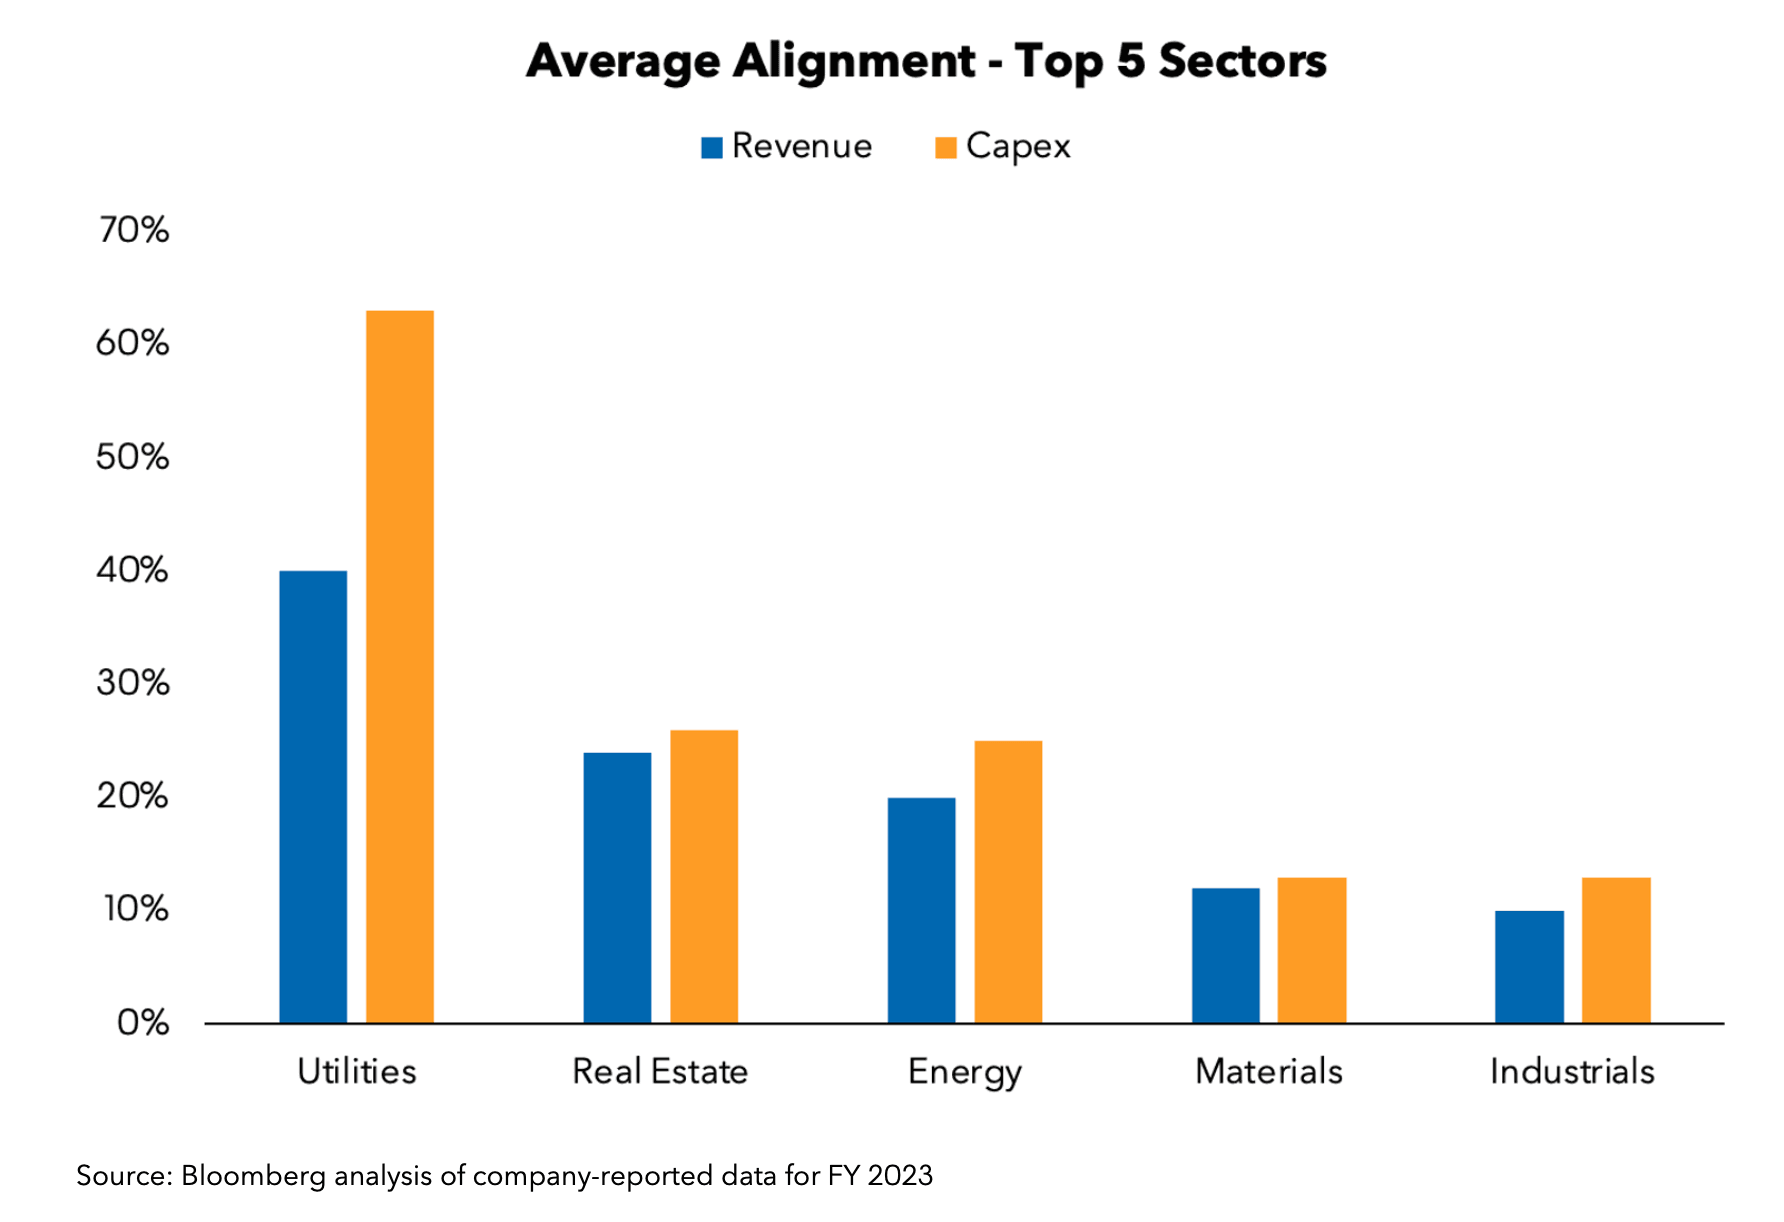
The EU Taxonomy disclosures help to create sustainable portfolios. The 5 sectors that are furthest ahead in the transition are: Utilities, Real Estate, Energy, Materials and Industrials.
The average alignment of capital expenditure in the Utilities sector is over 60%.
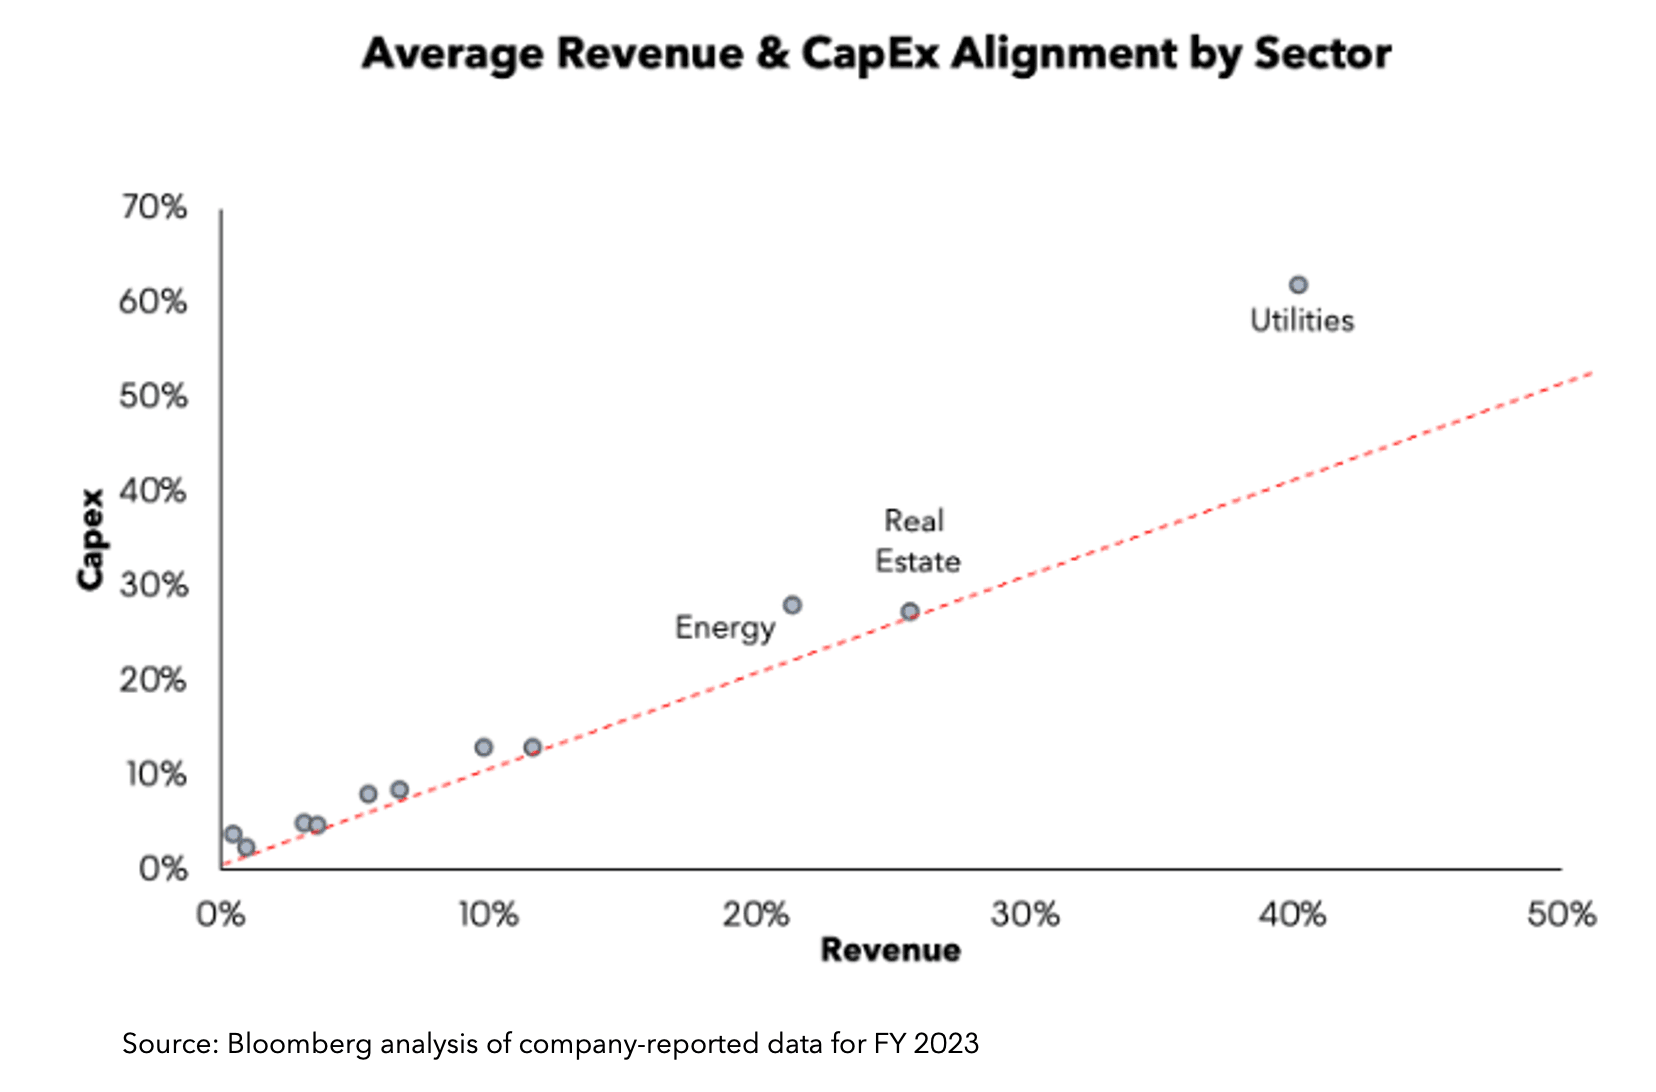
Investors can expect company activities to become more sustainable in the years ahead whenever a company’s capex alignment is higher than its revenue alignment.
It is therefore significant that, on average, every sector in Bloomberg’s dataset is becoming greener - although their starting point and speed of travel vary greatly between sectors.
In our analysis, the Utilities sector is experiencing the fastest transition to sustainability in terms of alignment between revenue and capex as determined by the delta between both.
Average Revenue & CapEx Alignment (2023)
All analyzed sectors are progressing:
Utilities: 62%
Energy: 28%
Real Estate: 27%
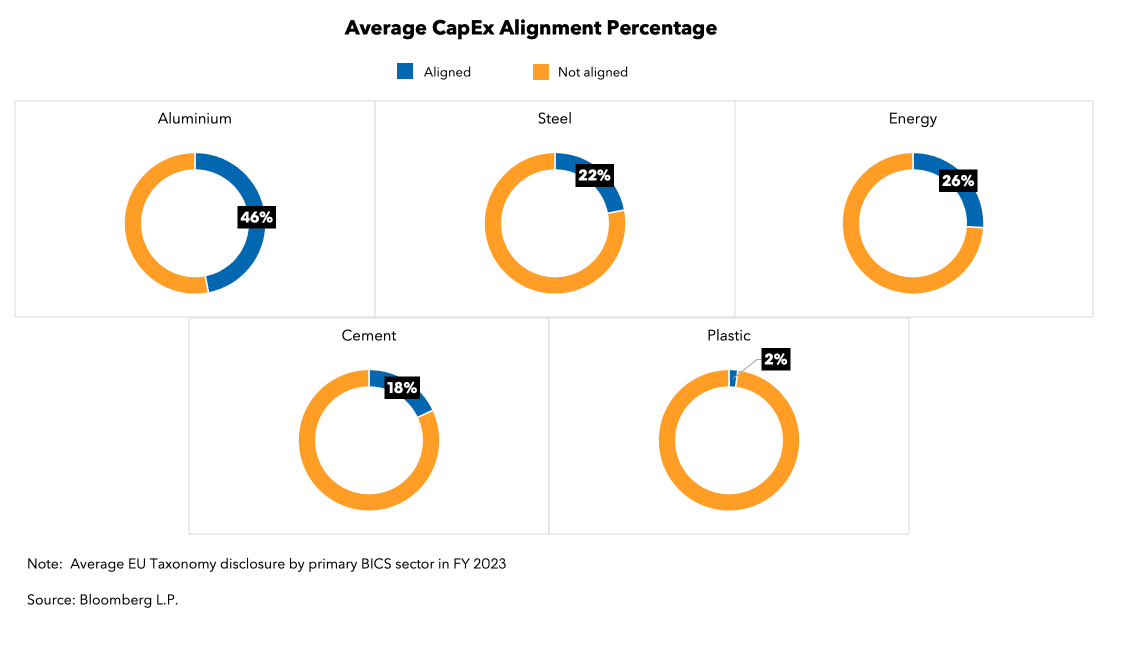
This graph shows the % of taxonomy-aligned capital expenditure of companies in carbon-intensive industries.
Among the selected industries, Aluminum ranked first with 46% capital expenditures, followed by steel, energy, and cement.
On the other hand, Plastic came in last with just 2% capital expenditures.
What are the costs and savings associated with industries looking to decarbonize? Find out in this analysis by BloombergNEF.
Looking for sustainable finance insights?
Subscribe to our ESG Newsletter. Each month, we curate content and insights on the ESG investment landscape, regulatory updates, and more. Sign up here.
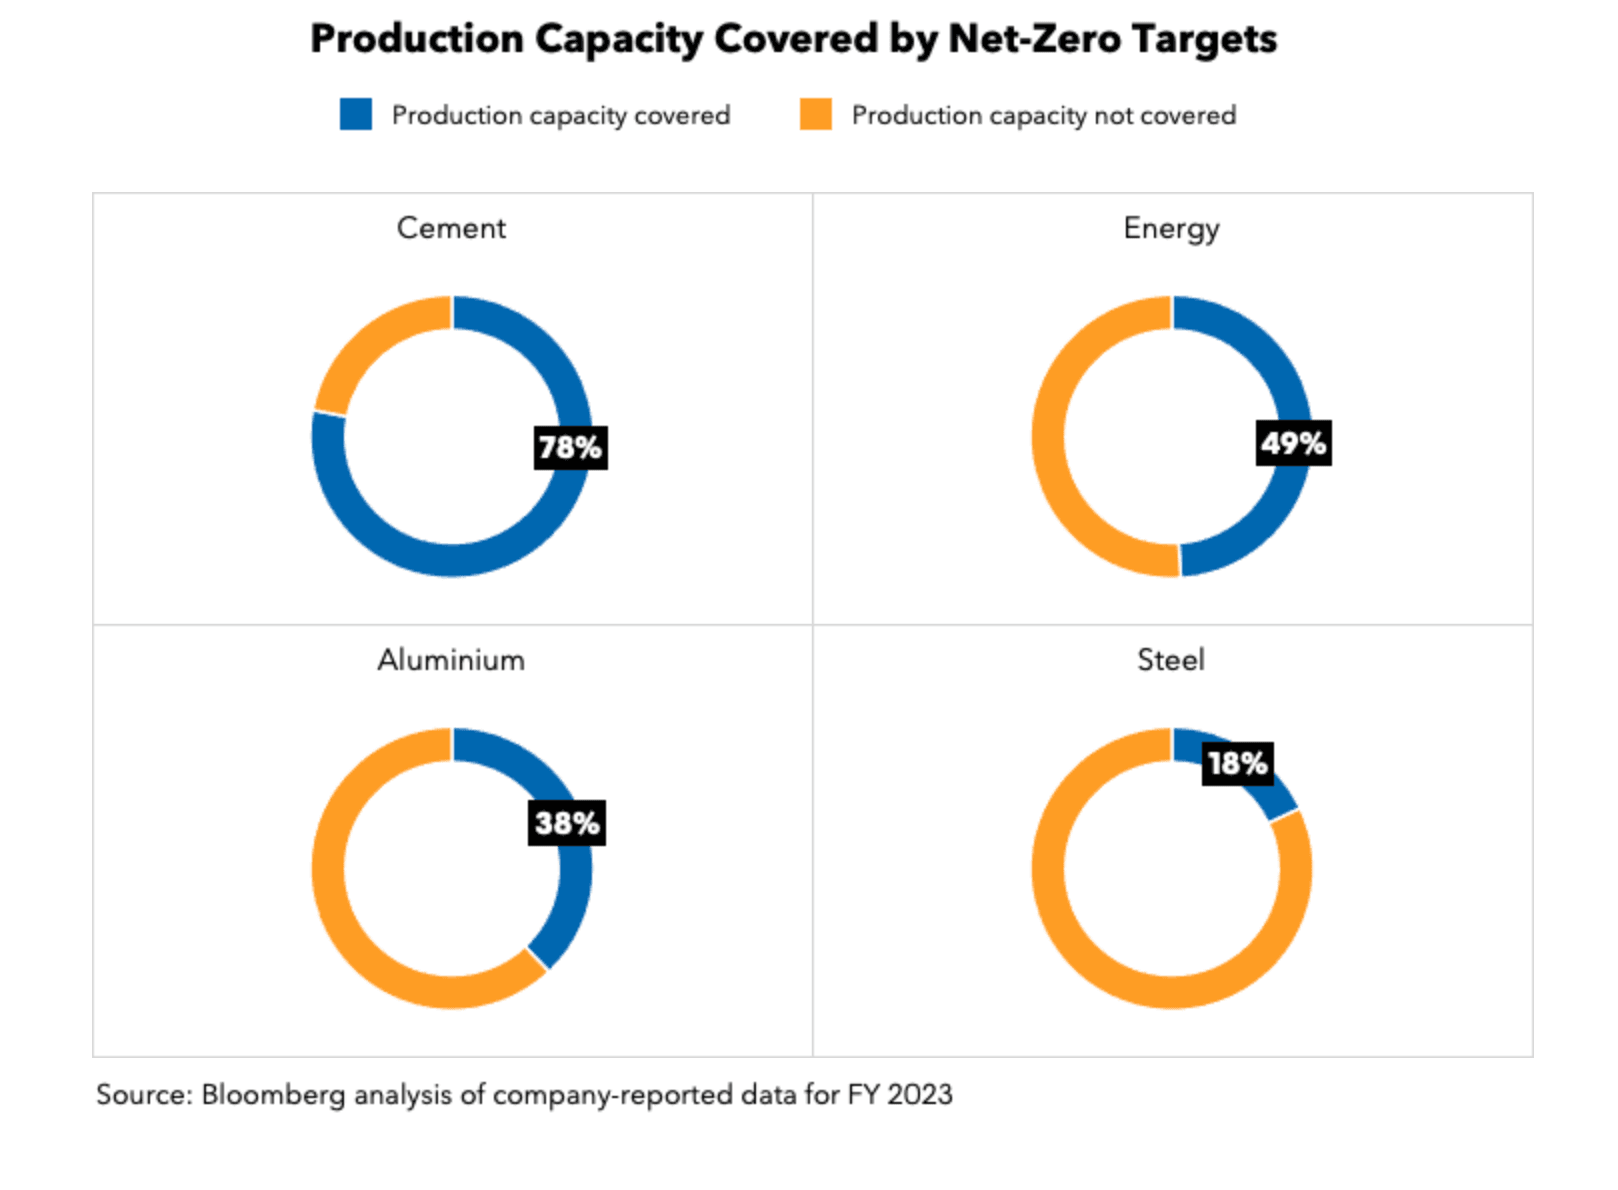
In addition to Taxonomy data, investors should analyse whether companies are committing to net zero targets.
For the manufacturing sector, 78% of Cement production is now covered by commitments to hit net zero and for energy production 49% of fossil fuel based energy is covered by some decarbonising commitment at firm level.
Steel, on the other hand, has the lowest commitment level within the analyzed group, at 18%.
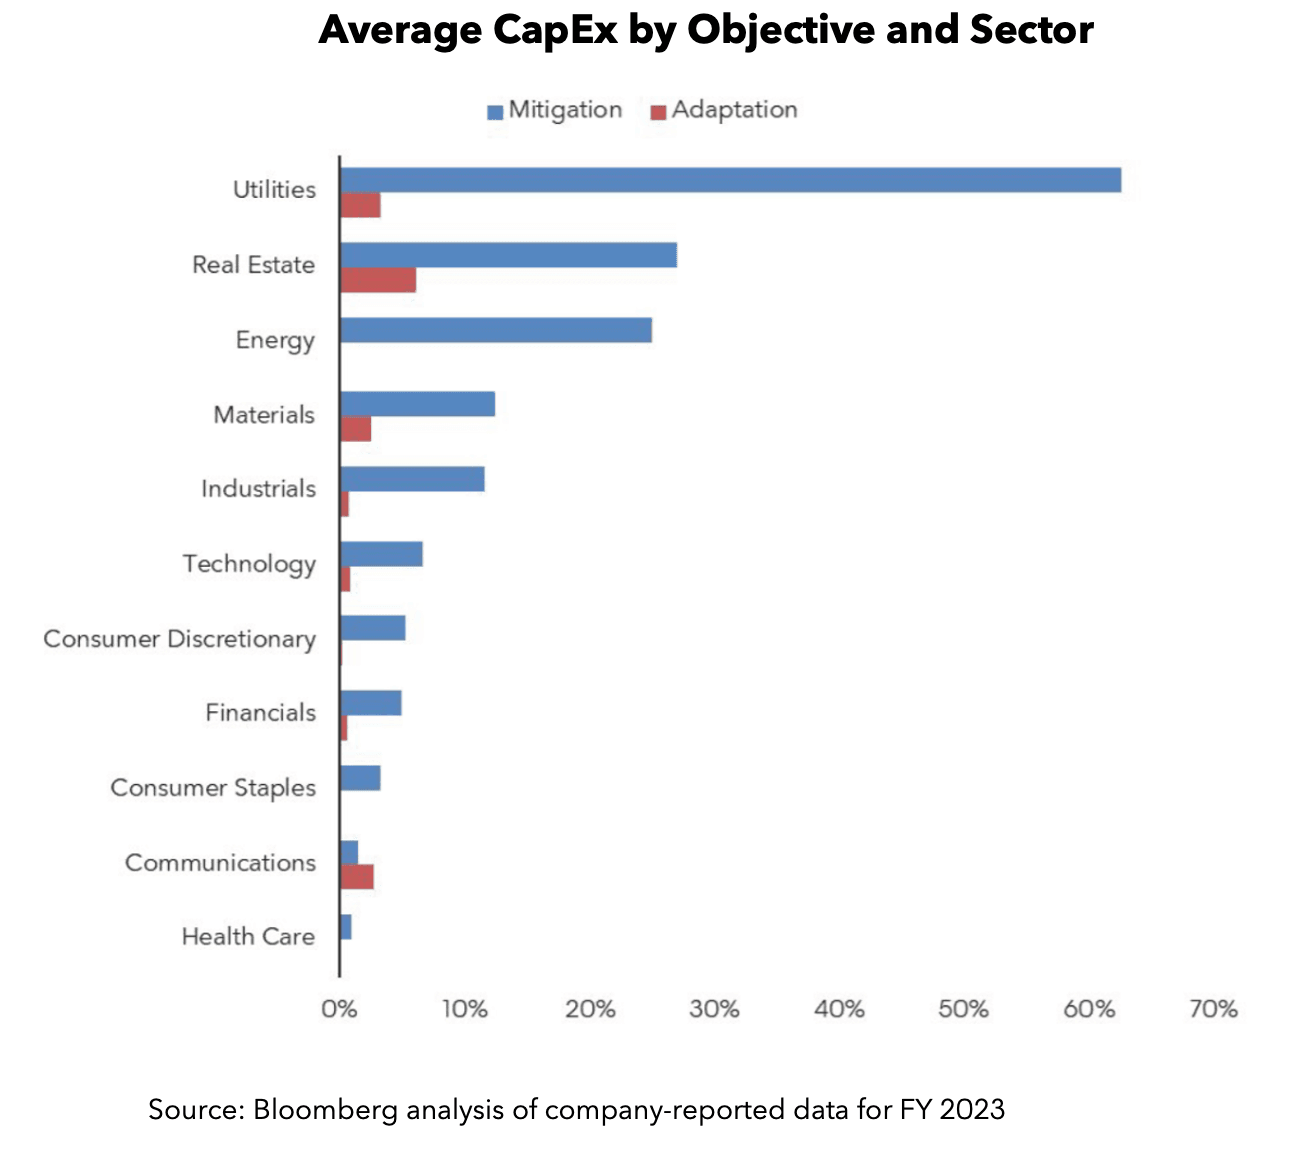
Large companies are mainly focusing their investments on climate change mitigation. This is a rational response to market signals (e.g. clean energy is getting cheaper) and corporate net zero targets.
That said, climate change is already upon us. At some point, companies will have to invest in adaptation strategies to prepare for a warmer, riskier planet.
Not surprisingly, Real Estate is the sector with the highest average CapEx alignment to climate change adaptation. Other sectors with fixed assets vulnerable to climate risk include Utilities, Materials and Communications.