Achieving this with speed and efficiency requires tools that can find patterns in assets with varying characteristics. This is only half the battle, though. It is just as important to visualize data in a meaningful and digestible format.
Fortunately, many of these features already exist on the Bloomberg Terminal. The powerful financial platform puts users' everyday needs — from accessing high-quality data to displaying valuable insights — in a central location, saving them time and money in various market environments.
What’s more, the charting functionalities can communicate relationships and trends in what is typically noisy data. What stands out is the ability to graph individual index characteristics while also comparing returns across sectors and asset classes.

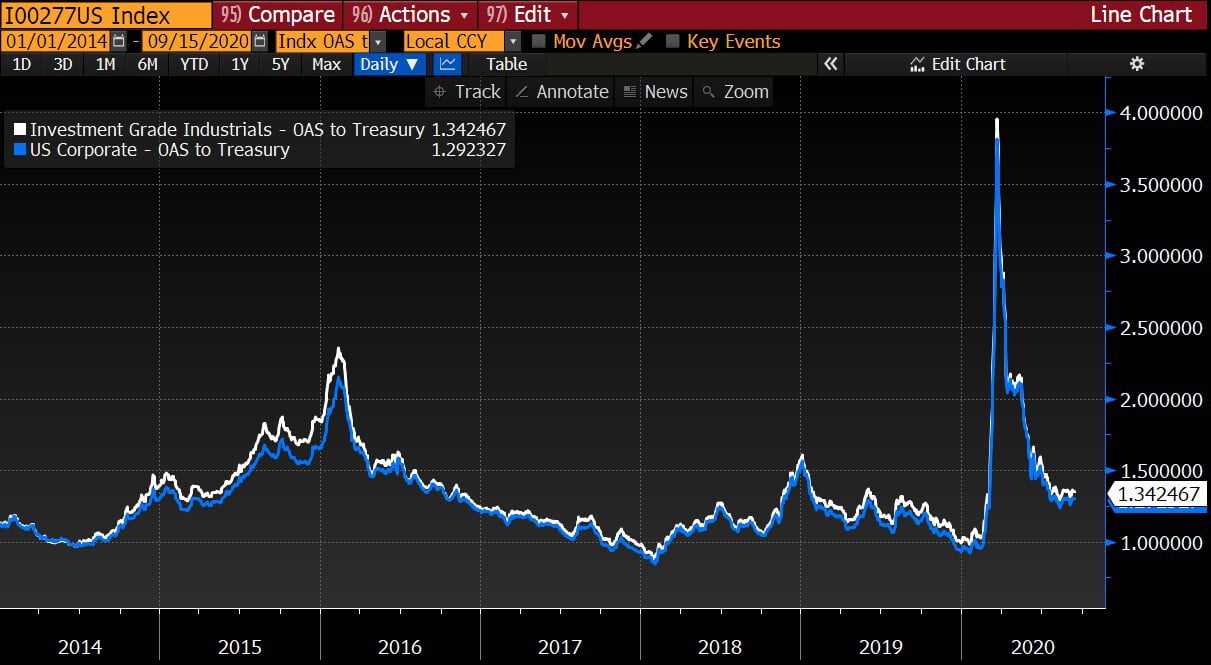
OAS of the US Investment Grade industrials index (I00277 US Index) vs. the OAS of the US Corporate Investment Grade Index (LUACTRUU Index)

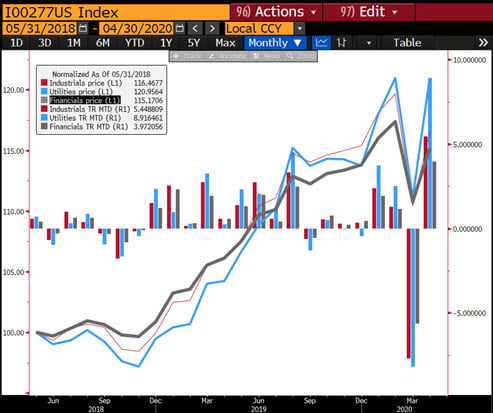
'This chart displays the BClass Level 2 Industrials, Utilities and Financials subsectors of the credit index and their monthly performance over the last year.