The tools help save time, create distributable worksheets and work in conjunction with other functions on the Terminal.
The need for and importance of these tools became increasingly apparent at the onset of the coronavirus pandemic, when the standard responses, like tax cuts or stimulus spending, were not sufficient. Bloomberg’s relative value capabilities add value in how they help users adjust to new policies. At the onset of the pandemic, investors could seamlessly make comparisons across different qualified issuers and bonds during a time of extreme market volatility.
Take the CARE Act, for example. The $2.3 trillion stimulus package passed in March provided much-needed economic relief to individuals and small businesses challenged by the pandemic. Part of the bill also included provisions for a Primary and Secondary Market Corporate Credit Facilities (PMCCF and SMCCF) managed by BlackRock.
The PMCCF was established to funnel credit to corporations through bond and loan issuances, while its partner program, the SMCCF, allowed the Federal Reserve to purchase individual ETFs that cover the corporate debt market.
To qualify for either program, companies must be rated investment-grade as of late March. Even recent “fallen angels” — bonds downgraded to junk status after the specified date — met the Fed’s criteria. Bloomberg’s relative value capabilities highlighted much of this information in real time, giving users what they needed to make informed decisions during this time of great uncertainty.

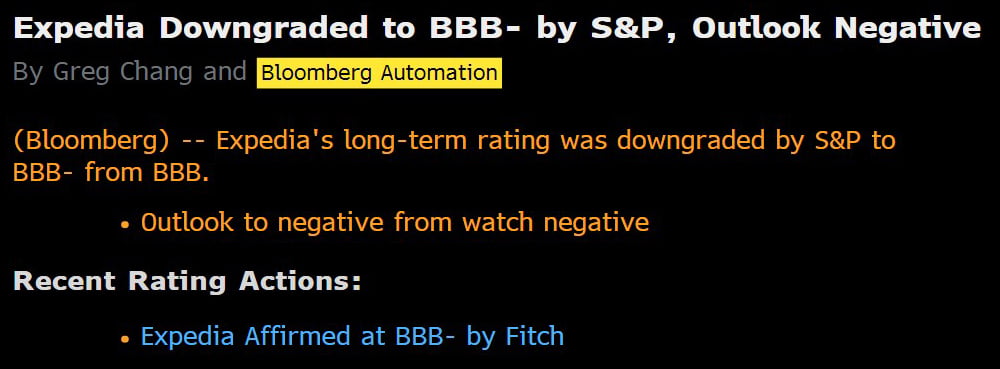
Excerpts from BI CREDIT coverage of coronavirus crisis effects on credit sector
Another tool for performing a wide range of comparative analyses on individual bonds is the Fixed Income Worksheet. FIW integrates multiple Bloomberg Professional® fixed income functions, simplifying your workflow so you can track pricing, performance, relative value of bonds in specific sectors, with specific issuers, and liquidity of multiple bonds simultaneously. Analyze your search results in many different ways, make quick comparisons of multiple bonds at once, analyze lists from multiple sources on the Terminal and display results in a chart or table, so you can plot and save curves and perform liquidity analyses.
interest rates, spreads and credit ratings, among others. Knowing what drives many of these indices can help users find the best value when choosing an asset.
Use PORT <GO> to analyze the risk and historical performance of a portfolio relative to a benchmark. Users can see constituent-level data and weights for the Bloomberg Fixed Income Indices with PORT.
Once a user is on the Terminal, they can analyze periodic returns under the “Performance” tab or quickly identify interest rate risk and spread exposures and view a comprehensive set of supplemental metrics under the “Characteristics” tab.
With functions like W <GO>, FIW <GO>, PORT <GO> and our charting capabilities, users have access to a robust set of tools that can improve their day-to-day indexing activities. Unlike other services, the Terminal’s functions are ready to use out of the box or can be customized to meet an investor’s unique needs.
In doing so, Bloomberg continues to deliver on the pillars of the index business: data, pricing, analytics, distribution and research. Bloomberg is the only provider who aggregates each pillar in a comprehensive, user-friendly platform.